Body Fat Percentage Chart: What Each Range Looks Like
Quick answer: See what 8% to 35%+ body fat can look like across body types, with range context and photo check-in tips before comparing or overreacting later.
If you searched for a body fat percentage chart, you want visual context, not just numbers in a table. This guide explains what each range tends to look like, what training and nutrition context usually applies, and how to figure out where you are right now.
For a quick estimate based on your own photos, try a free AI body analysis.
Body fat percentage ranges for men
These visuals are synthetic broad references, not diagnostic examples. Lighting, muscle mass, genetics, frame size, age, and fat distribution can make two people at the same percentage look different.
Essential fat: 2-5%
Competition-bodybuilder territory. Not sustainable for normal life. Hormonal function, energy, sleep, and recovery are often compromised at this level.
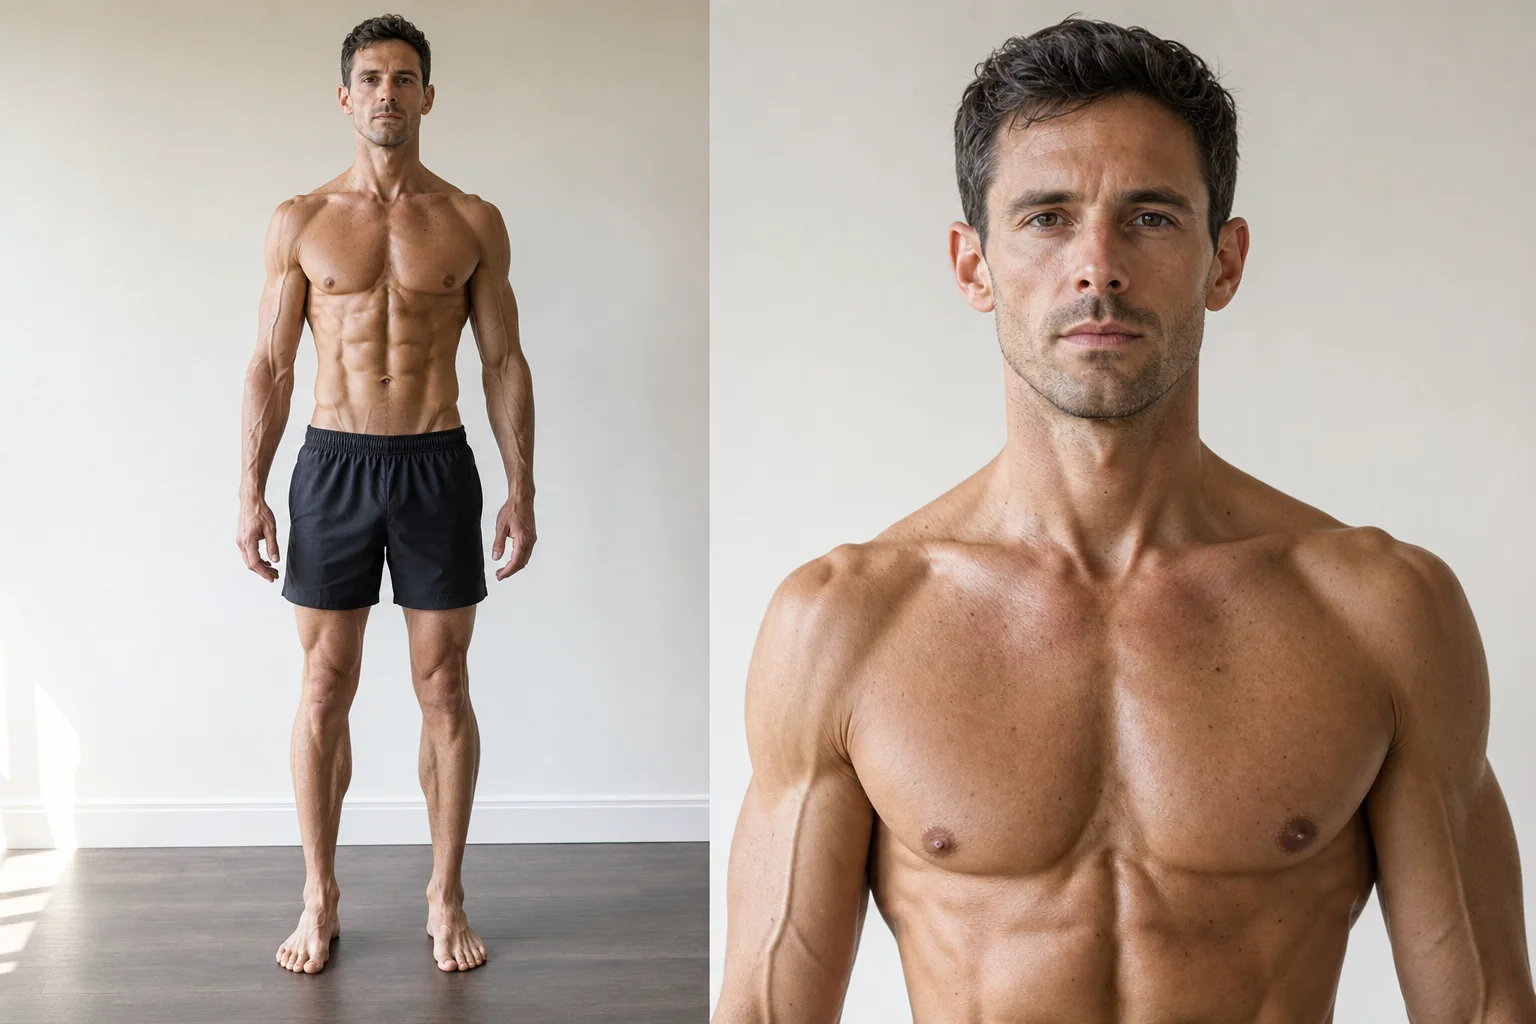
Athletic lean: 6-9%
Visible abs with deep separation, strong vascularity, and a very lean face. This range is usually maintainable only for short periods and requires strict nutrition.
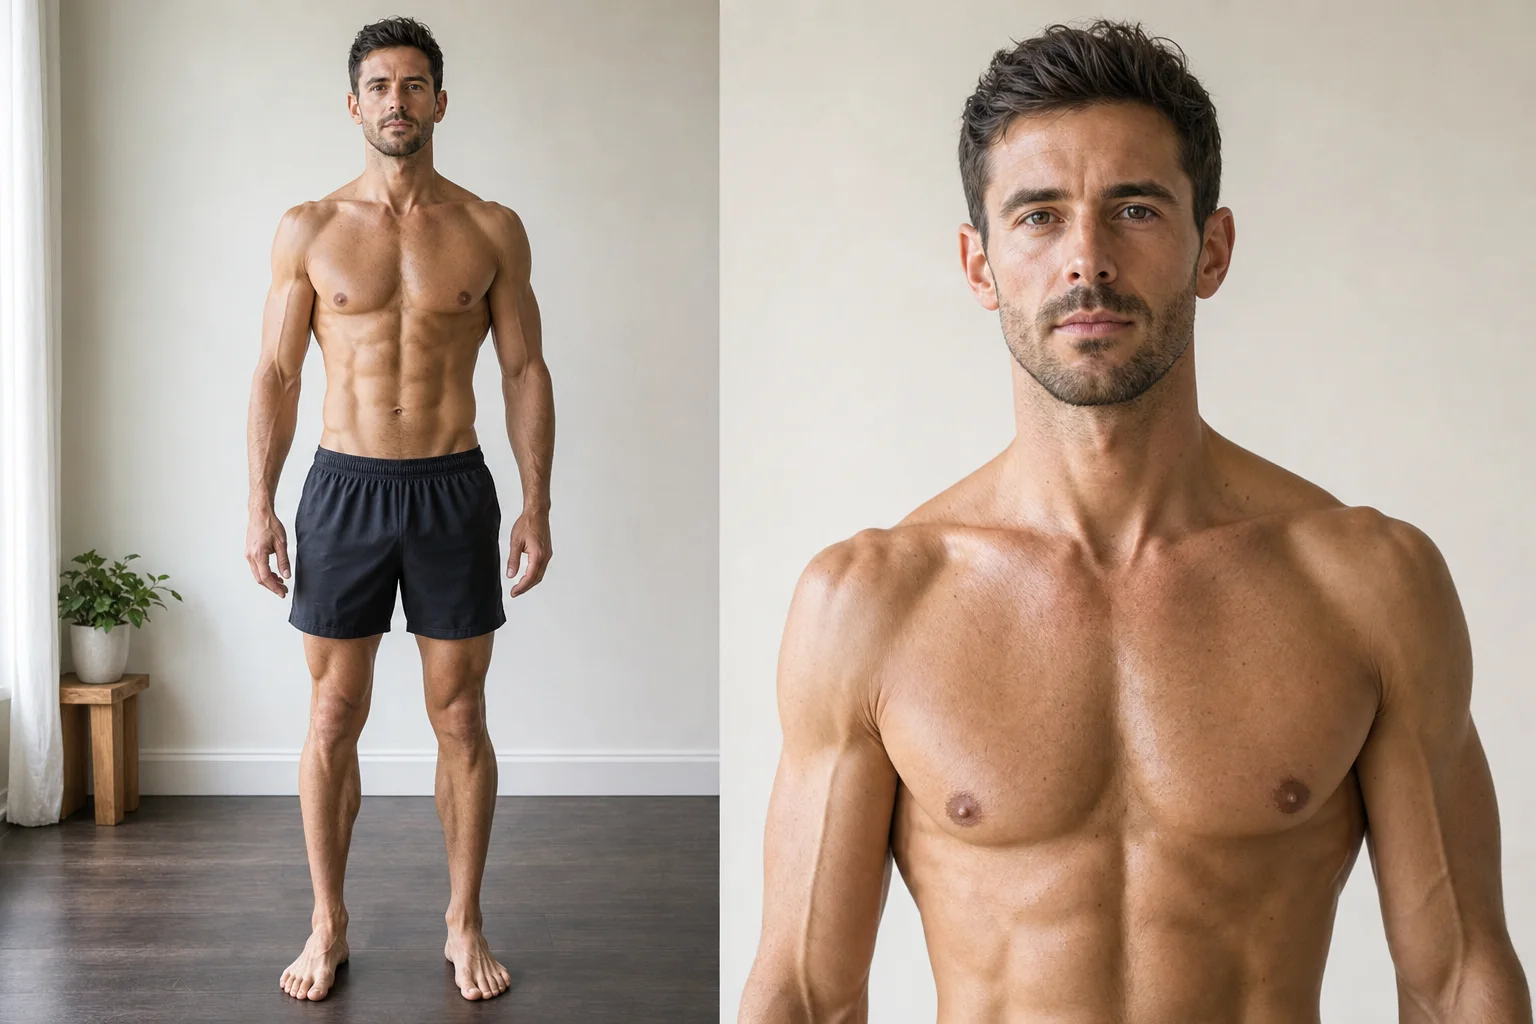
Fit lean: 10-14%
Clear ab outline, visible muscle separation through the upper body, and some vascularity. Most people who look ripped fall in this range. It can be sustainable for some with consistent training and moderate nutrition discipline.
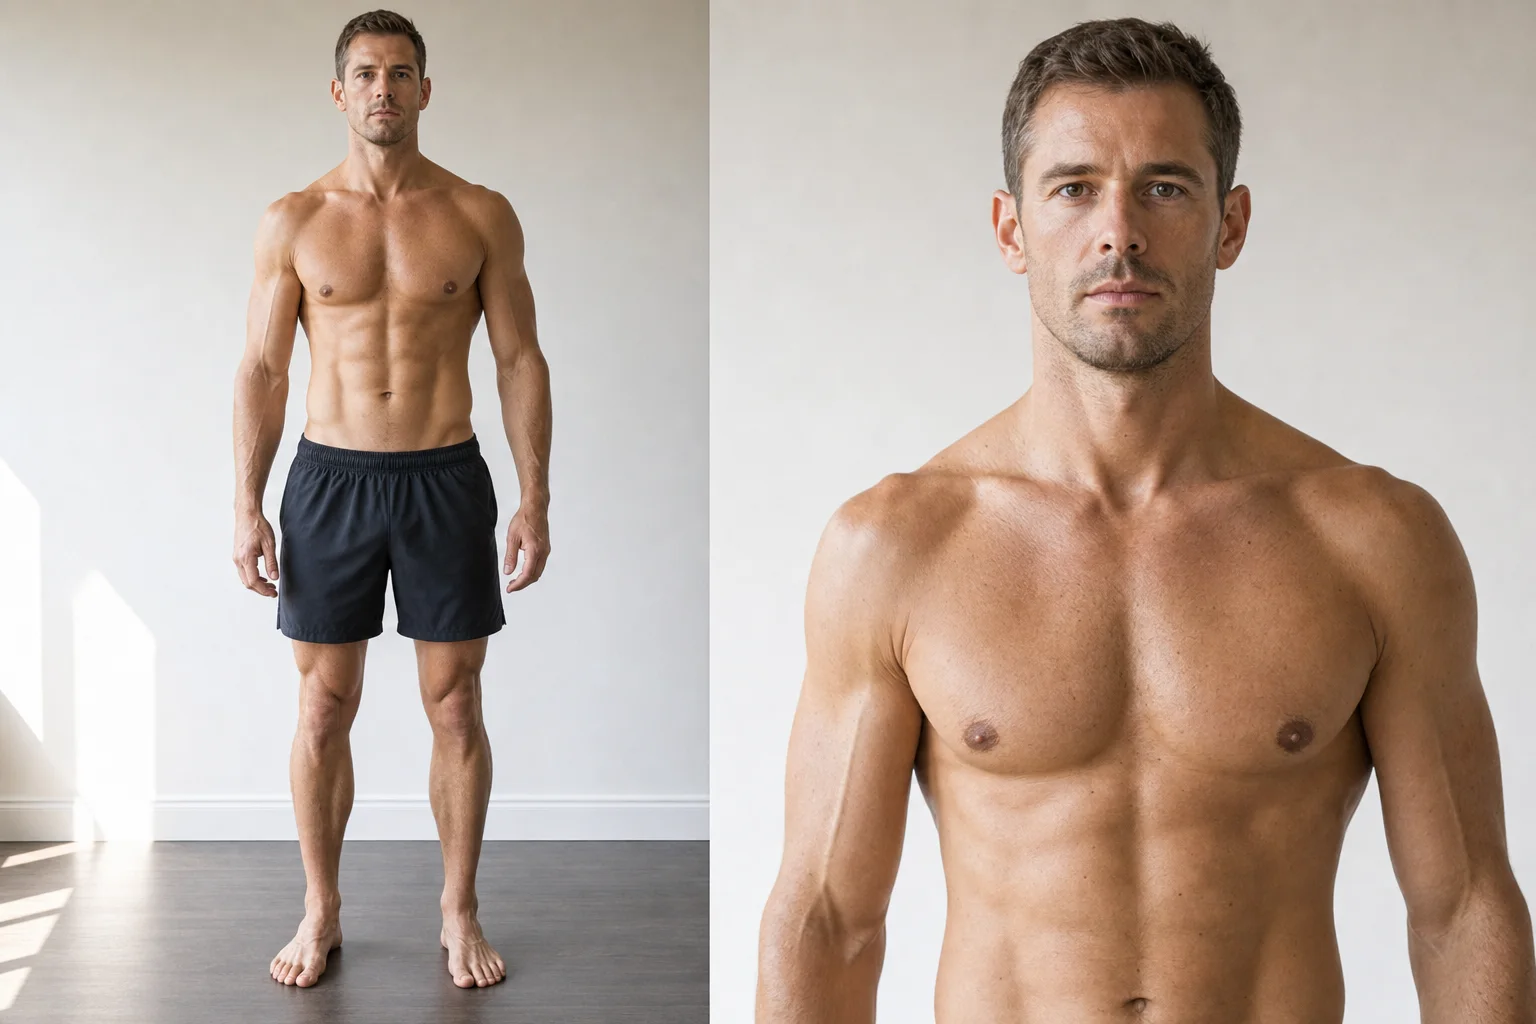
Healthy fit: 15-19%
Some muscle definition is visible, especially chest, shoulders, arms, and upper back. The midsection looks flat or slightly soft. Many regularly training men land here.
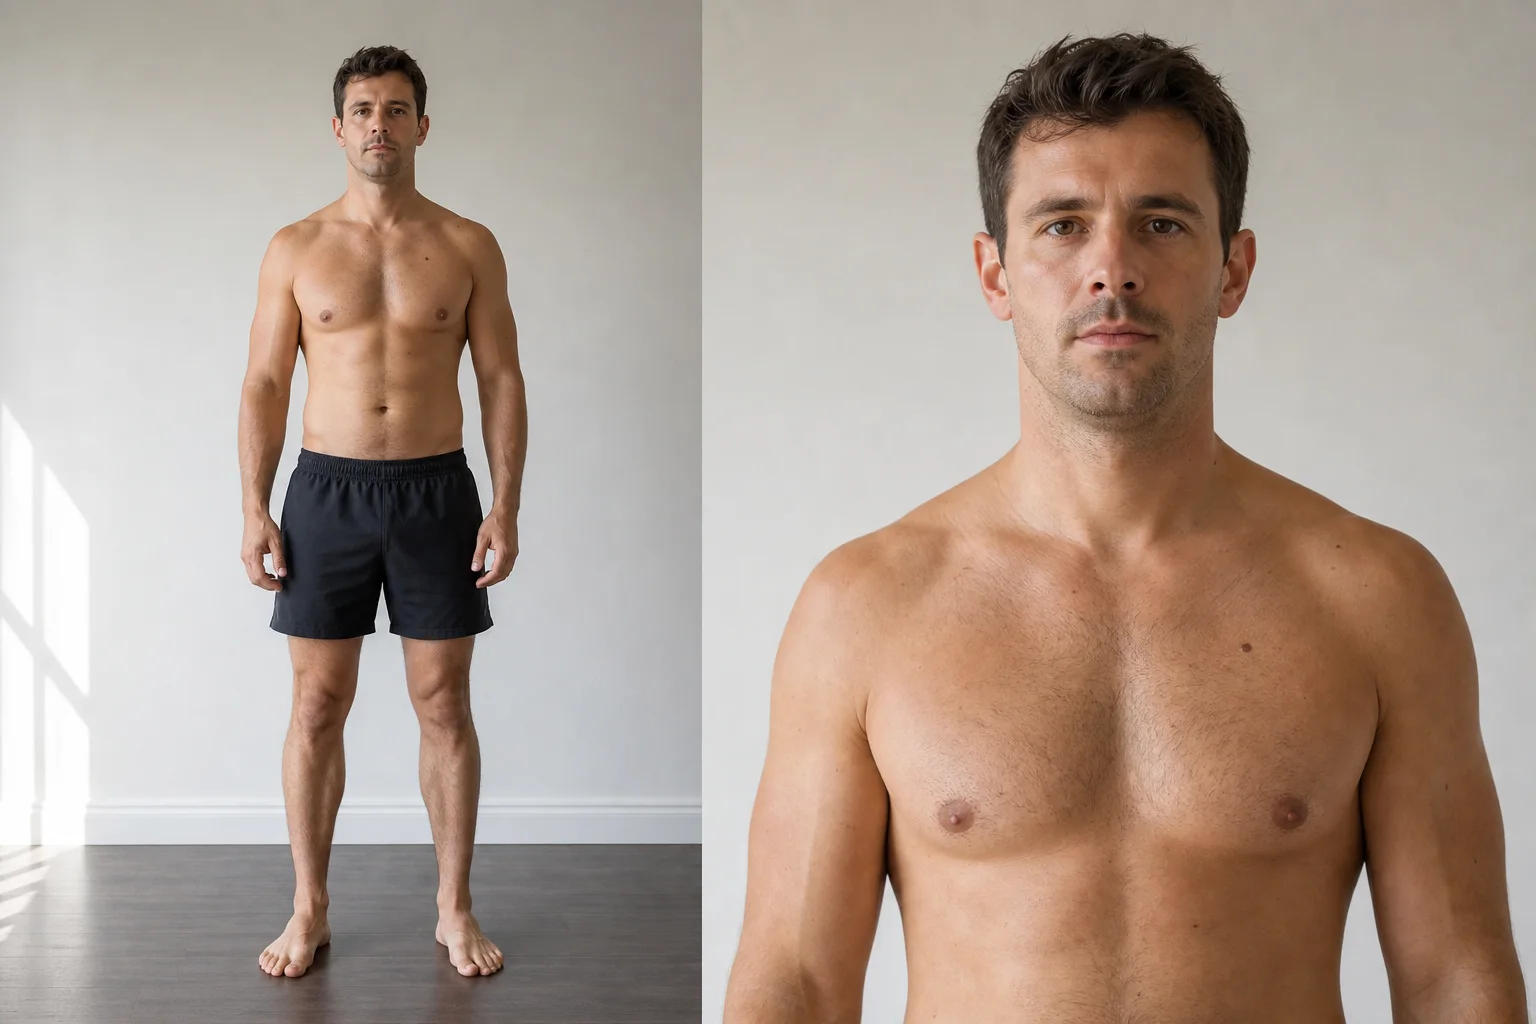
Average: 20-24%
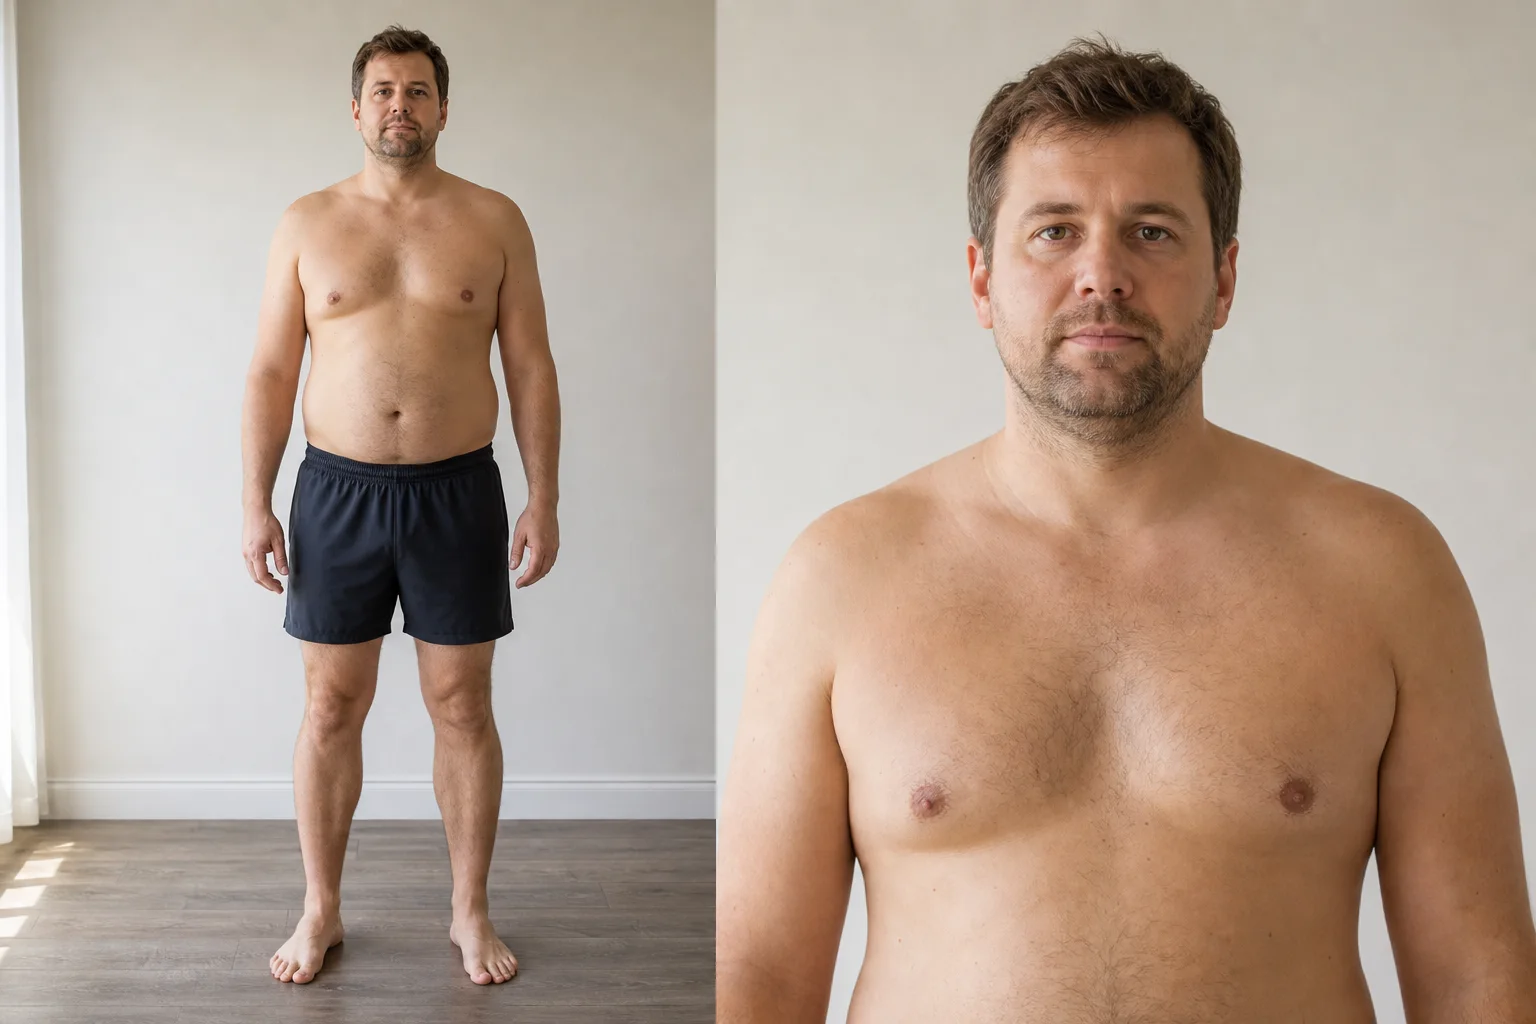
Softer overall appearance. Muscle shape may be visible but not defined. The midsection usually carries more softness.
Above average: 25-29%
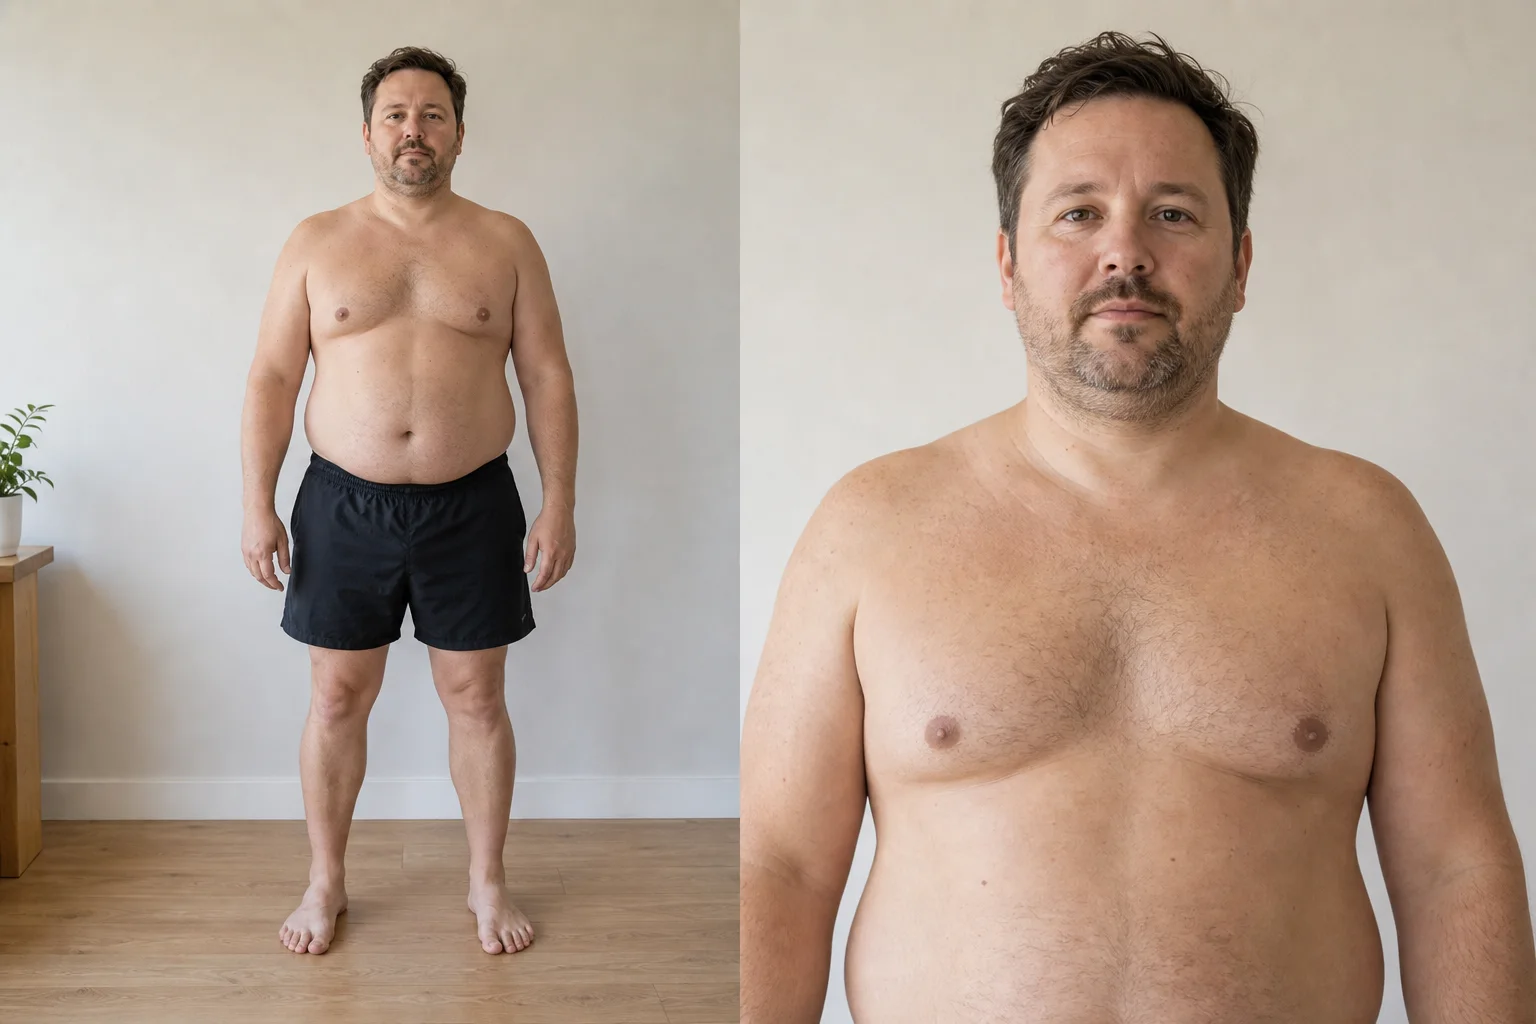
More noticeable midsection and lower-back softness. Less visible muscle definition. The face may appear rounder.
Obese range: 30%+
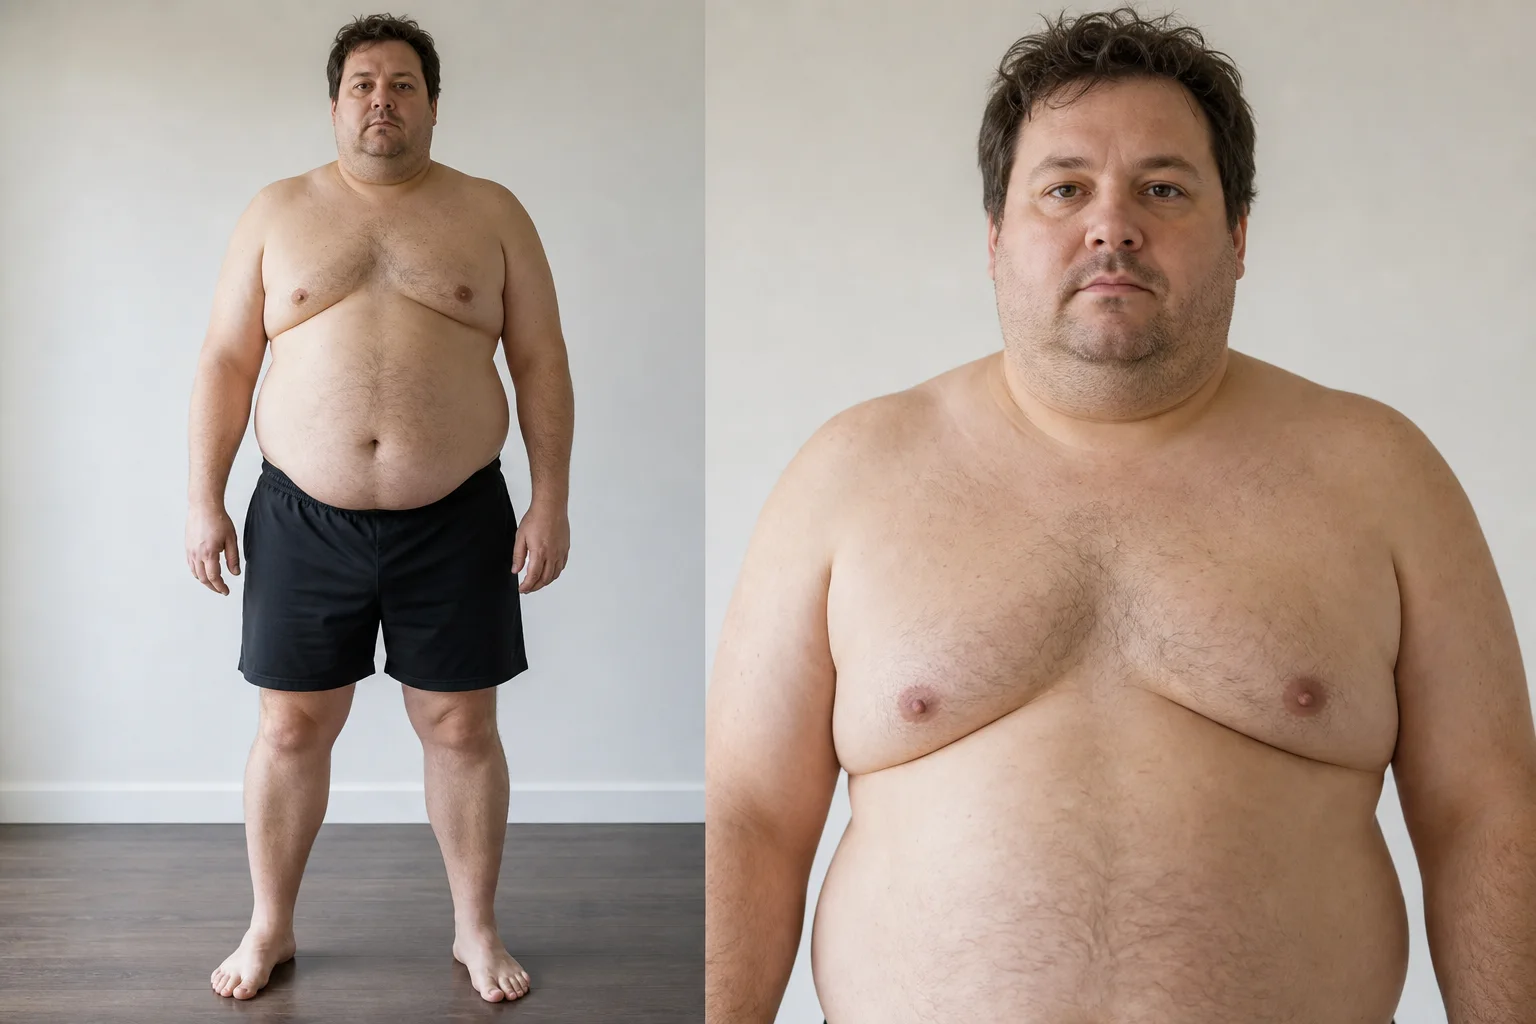
Significant fat accumulation, especially around the midsection. Muscle definition is mostly hidden. Health risk factors often increase in this range.
Body fat percentage ranges for women
Essential fat: 10-13%
Competition-level leanness for many physique athletes. Menstrual function may be disrupted. This is not a normal maintenance target.
Athletic lean: 14-17%
Visible muscle definition and minimal visible body fat on limbs. Some women in physique sports may compete around this range. It can be difficult to maintain.
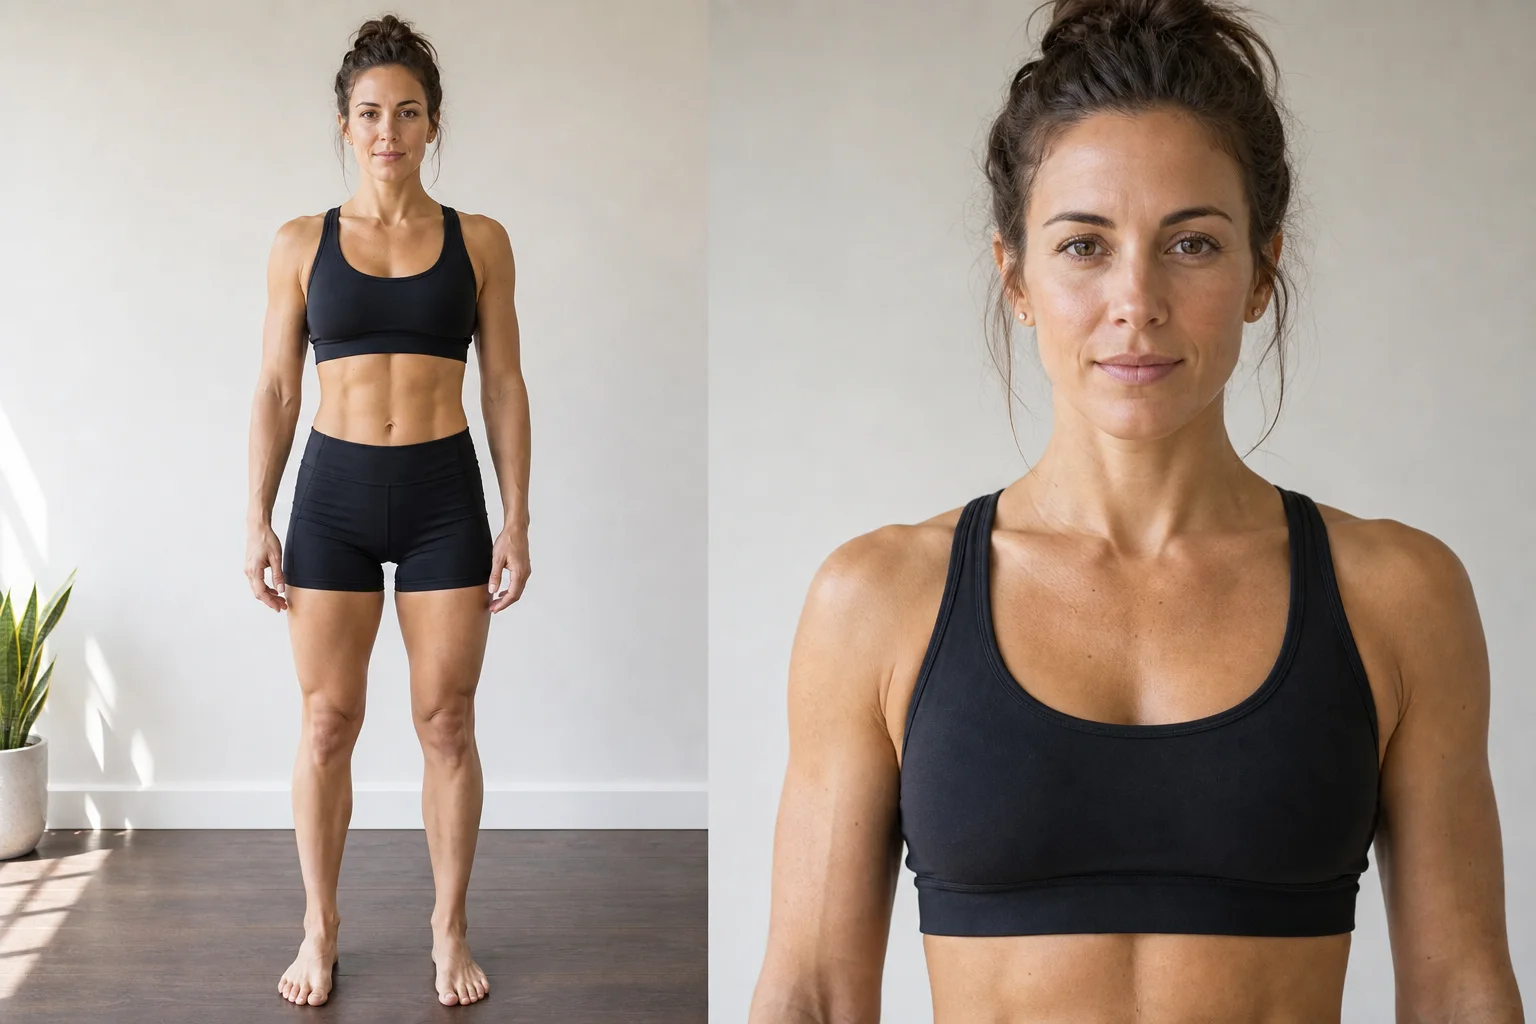
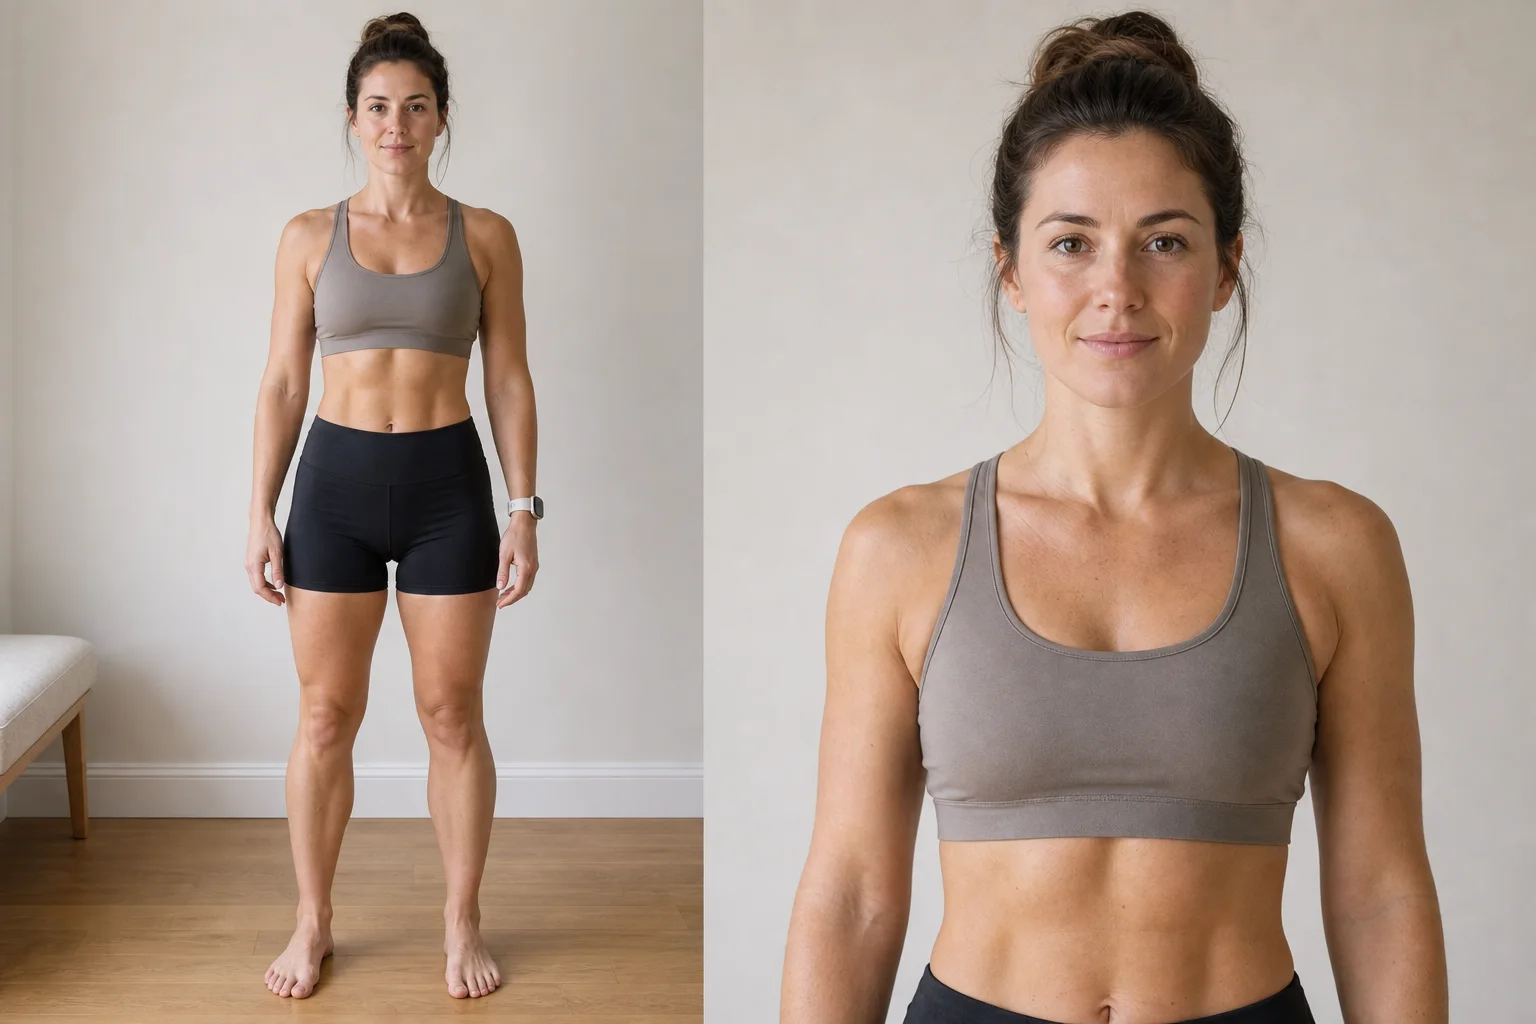
Fit: 18-22%
Toned appearance with visible muscle shape. Often sustainable for active women and a common goal range for people who train consistently.
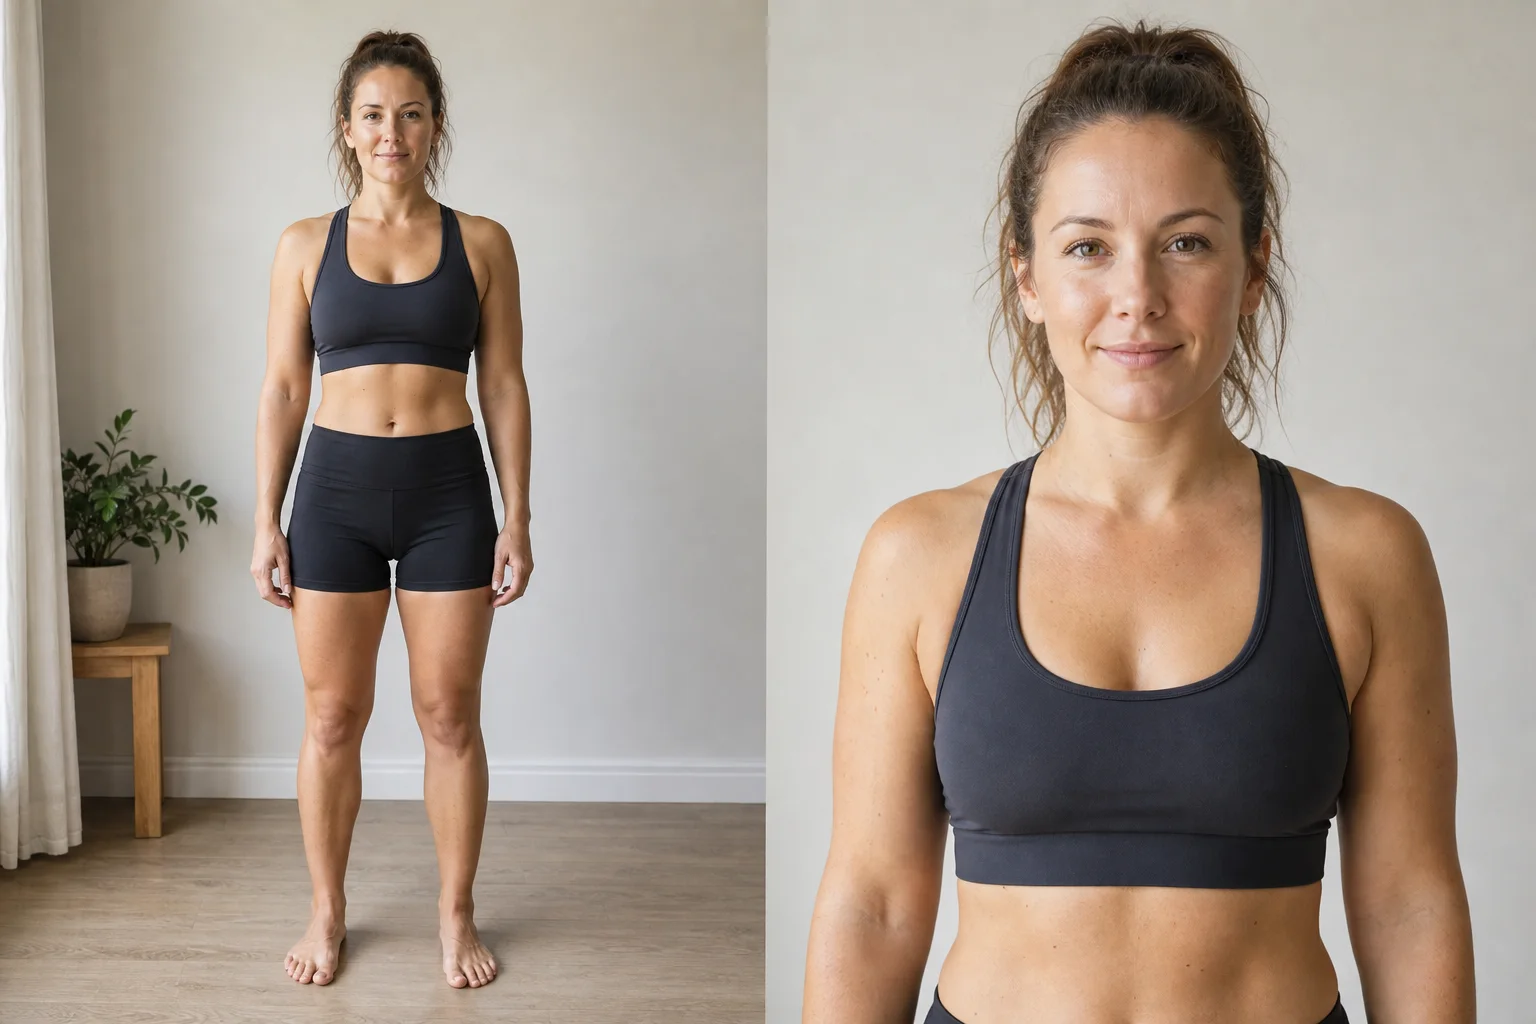
Healthy: 23-27%
Softer muscle outlines while still looking active and healthy. Many consistently active women land here.
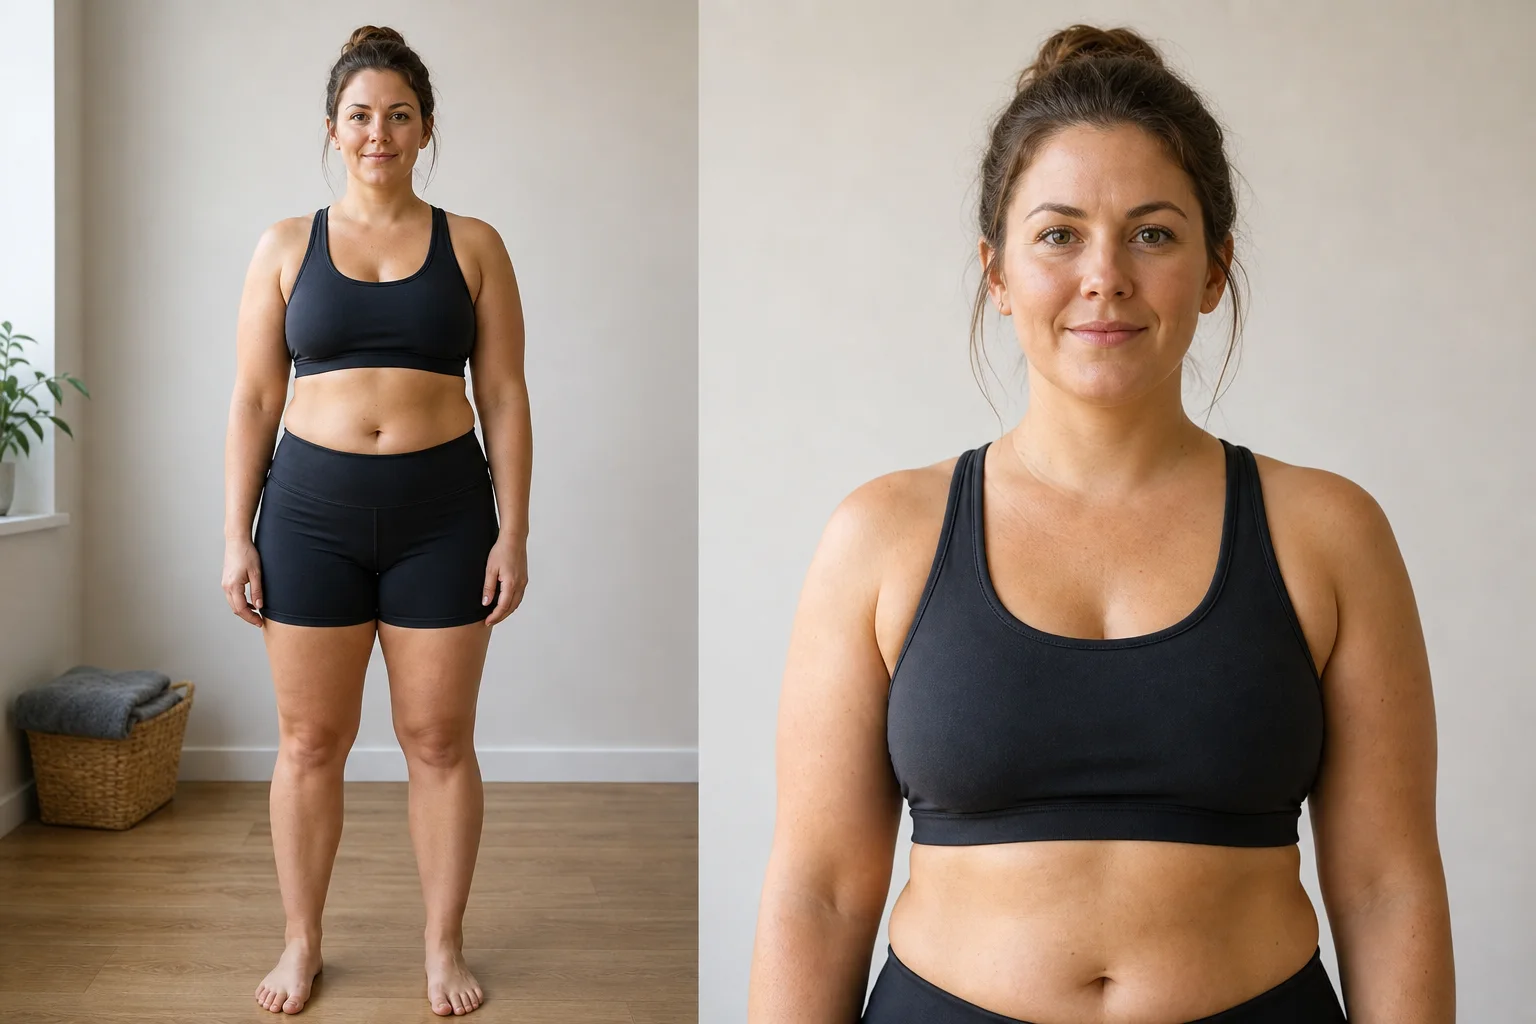
Average: 28-32%
General softness and less visible muscle definition. Normal for many adult women.
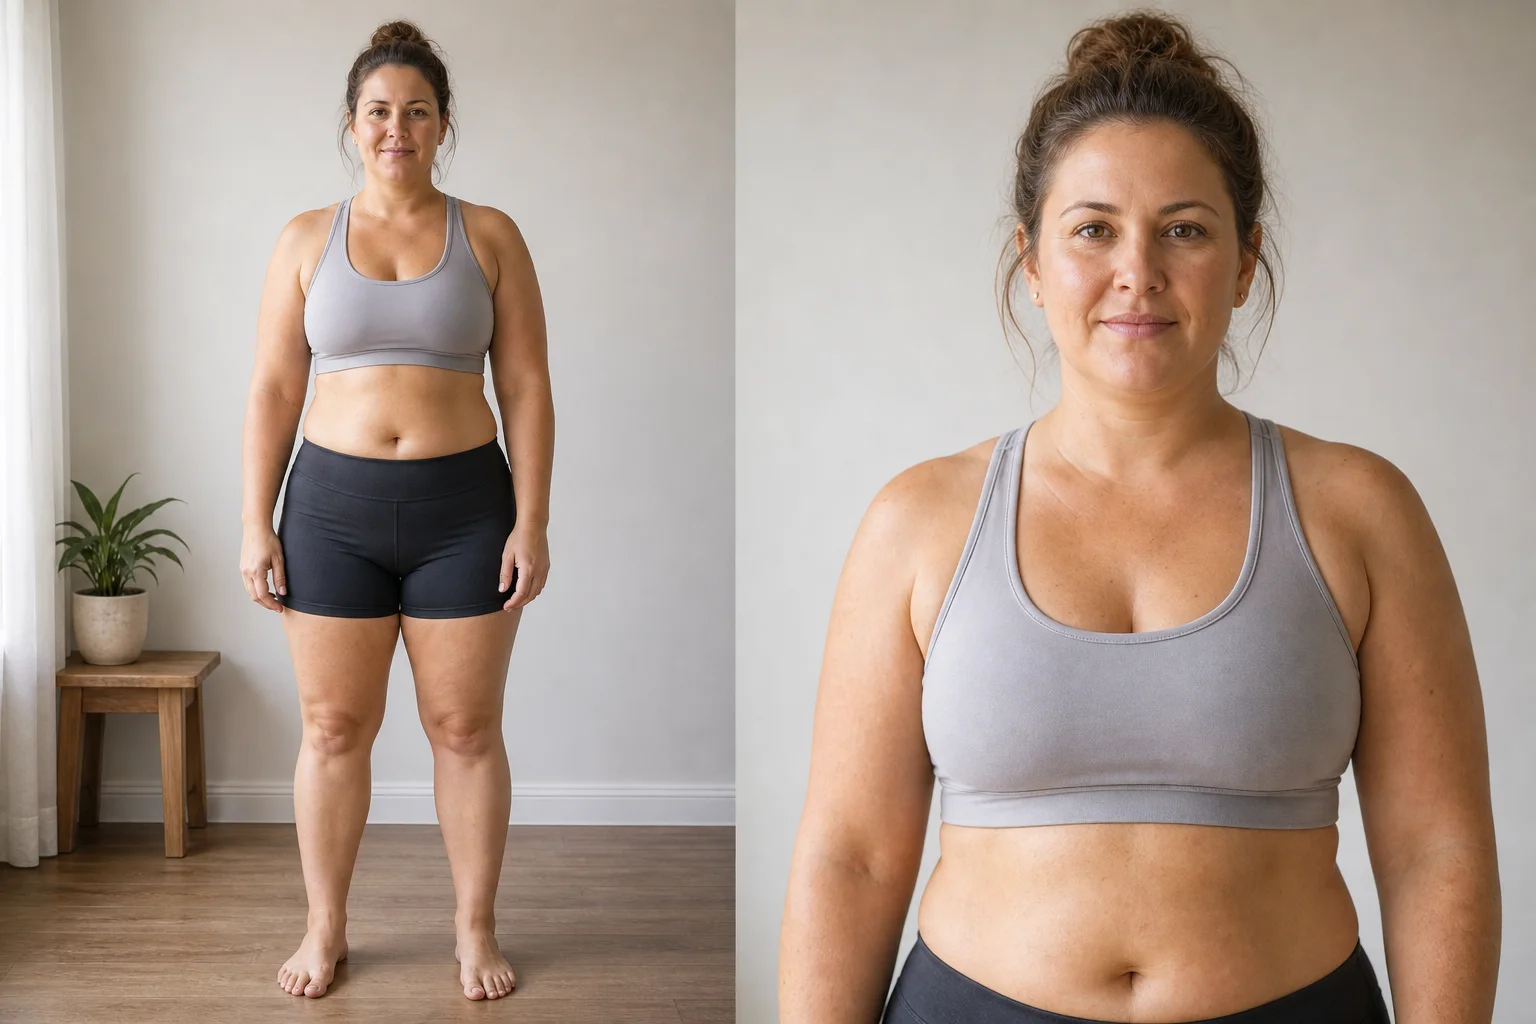
Above average: 33%+
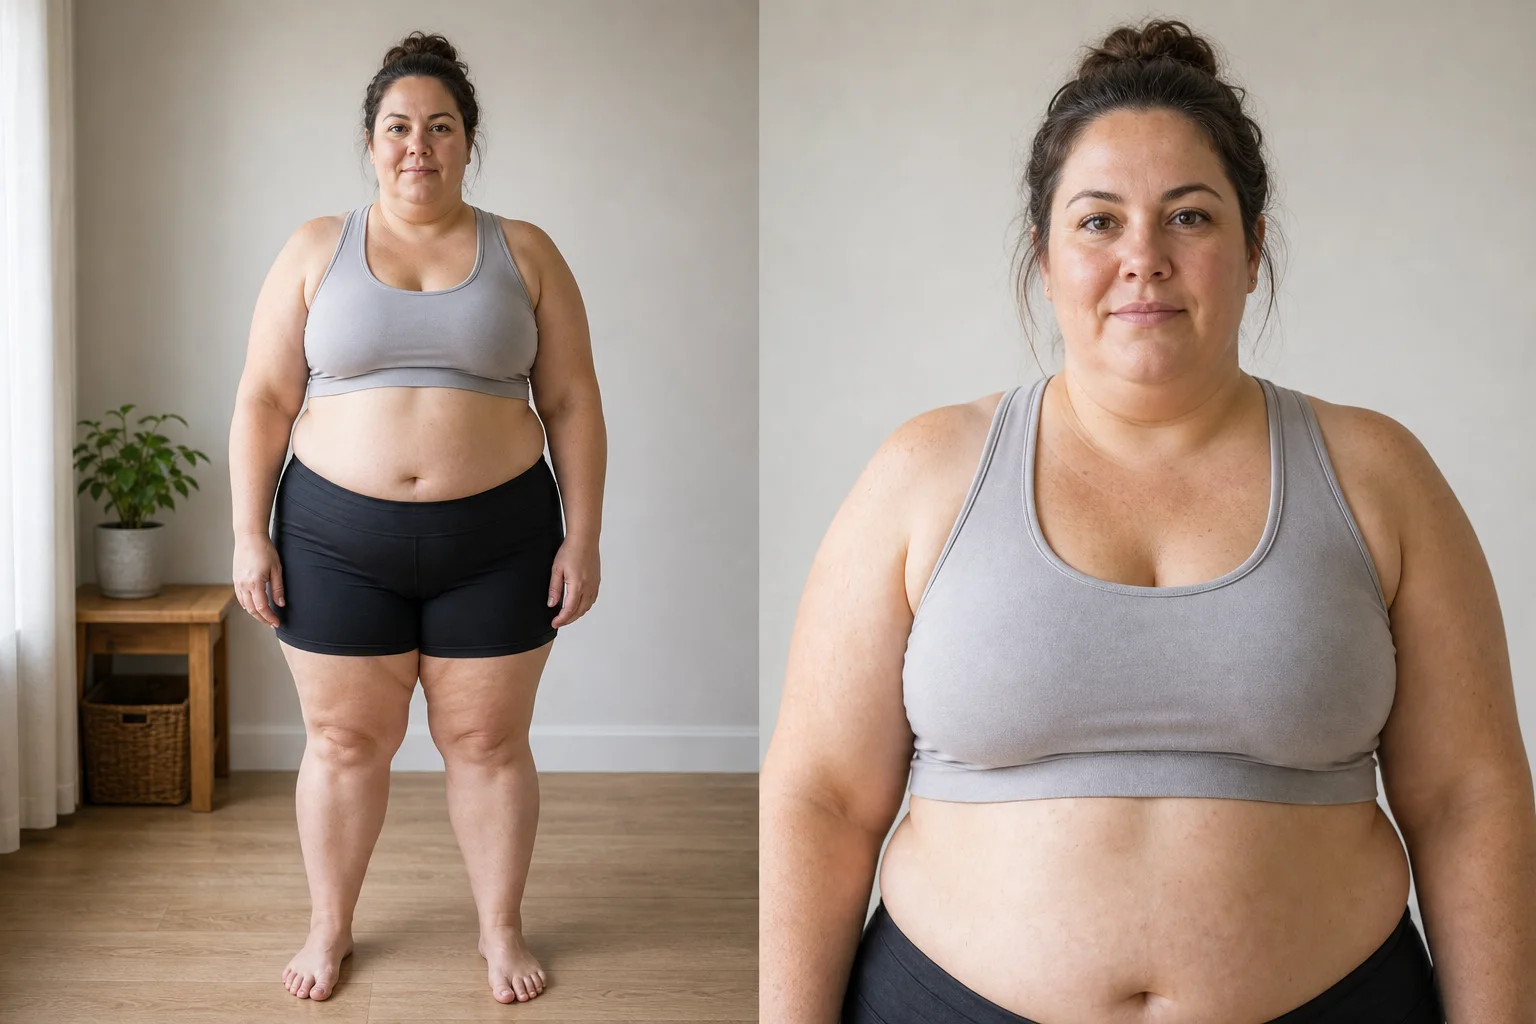
Noticeable fat accumulation and less visible muscle shape. Health risk factors may begin to increase depending on the person and context.
How to estimate your body fat percentage
The most practical way to place yourself on this chart is a repeatable photo check-in. You do not need calipers or a DEXA appointment for directional tracking.
- Take a consistent photo: same lighting, pose, distance, and clothing.
- Upload it to an AI body fat analyzer.
- Read the range, not a single number.
- Compare to this chart for visual context.
- Track direction over four or more weeks before drawing conclusions.
For the detailed setup protocol, read how to take body fat photos.
Why LeanLens shows a range instead of a number
Single numbers feel precise but are usually misleading from photo inputs. A range, such as 14-17%, is more honest and leads to better decisions. You react to trends instead of reacting to a digit that shifted because your lighting changed.
Get a confidence-aware range and practical next steps from a single photo.
Photos are not stored in the LeanLens database after processing.
Run a Free AI Body AnalysisFAQ
What body fat percentage is considered healthy?
For men, roughly 10-24% is commonly treated as a broad healthy visual range. For women, roughly 18-32% is common. Individual health context, age, hormones, and medical history matter.
What body fat percentage do you see abs?
Many men start seeing ab definition below about 15%. Many women see stronger abdominal definition below about 20%. Genetics, muscle development, lighting, and fat distribution also matter.
Is a body fat percentage chart accurate?
Charts give general visual benchmarks. Individual variation in fat distribution, muscle mass, frame size, and photo conditions means two people at the same percentage can look different.
How can I check my body fat at home?
The most accessible method is a repeatable photo-based estimate. Upload consistent photos to a tool like LeanLens and track your range over time.